A few weeks or months from now, we could have a Covid-19 test kit sent to our home. Similar to a blood sugar test for diabetics, we would prick our finger, wait for a couple of minutes, and we will know whether we are immune or not. The general idea is that this would help in lessen the social distancing restrictions because those who are immune could in principle go back to a normal life.
But it is of course more complicated than that. In short: If an antibody test tells you that you are “positive” (i.e., you have developed antibodies and therefore are or should have been infected), the probability that you are actually immune is nonetheless very low because your test result is very likely a “false positive”.
Yesterday, I stumbled upon the following Twitter thread, which pinpoints at an important issue when it comes to antibody tests that should help to determine who was infected and who was not.
Antibody tests are coming online. Never before have humans needed to understand Bayes rule more. Let’s talk about why it’s critical NOT to assume you are immune to covid-19 when you have a positive antibody test. Seriously, people need to understand this to prevent many deaths.
— Taal Levi (@taaltree) April 10, 2020
Intuitively, most of us would probably think that the accuracy of a (antibody) test is primarily related to its precision. A test’s precision is denoted by its sensitivity (probability that a person tests positive given that they are indeed positive) and its specificity (probability that a person tests negative given that they are indeed negative). Cellex, which is the first company to get a rapid covid-19 antibody test approved by the FDA, has a sensitivity of 93.8% and a specificity of 95.6%.1 This sounds pretty good. Only 6.2% would be “false negatives” and only 4.4% would be “false positives”. But this oversimplifies the situation.
The problem is related to the known low probability of being or having been infected in the first place. From all (of course, biased) numbers that we know, the amount of people infected in a country is very low (e.g., in Germany, it would be 0.15% of the entire population at this moment). Even if unknown cases are ten times higher (e.g., cases without symptoms), we would still only have an infection rate of 1.5%. In Bayesian terms, this implies that our prior knowledge suggests that the probability of being “positive” is very low. Using Bayes theorem (which I won’t explain here), we can derive that it is very unlikely to be infected, even if the antibody test says that one is “positive”.2
Because this is a bit hard to grasp intuitively, let us simulate the problem. I therefore first define a function that:
1) creates a population with a certain percentage of infected people,
2) samples one person randomly, and
3) and conducts a test with a pre-defined sensitivity and specificity.
library(tidyverse)   # for data wrangling
library(MonteCarlo)  # for the simulation

test_sim <- function(rate = 0.001,
                     pop = 100000,
                     sensitivity = .95,
                     specificity = .95) {

  # Create population with an infected subpopulation
  data <- data.frame(id = 1:pop, corona = c(rep(1, pop*rate), rep(0, pop-rate*pop)))

  # Sample individual person randomly
  person <- sample_n(data, 1)

  # "test" the person
  if(person$corona == 1) {

    prob_sens <- sample(c(rep("correct", (sensitivity*100)),
                     rep("false", (100-sensitivity*100))), 1)

    if(prob_sens == "correct") {
      person$test_result <- 1
    } else {
      person$test_result <- 0
    }

  } else {

    prob_spec <- sample(c(rep("correct", (specificity*100)),
                     rep("false", (100-specificity*100))), 1)

    if(prob_spec == "correct") {
      person$test_result <- 0
    } else {
      person$test_result <- 1
    }
  }

  # return "true" infection and test result
  return(list("infected" = person$corona,
              "test" = person$test_result))
}
We can shortly test the function and see that in this one instance, 1 person of the 100000 was tested correctly as negative (0 = negative).
set.seed(42)
test_sim()
## $infected
## [1] 0
##
## $test
## [1] 0
Next, we set up the simulation. In the simulation, we will vary the sensitivity and specificity of the test as well as the amount of infected people in the population.
# Define simulation parameters
rate_grid <- c(0.001, 0.010, 0.050, 0.100, 0.200) # Rate of infection
pop_grid <- c(100000)                             # Population size
sens_grid <- c(.85, .90, .95, .99)                # Sensitivity of the test
spec_grid <- c(.85, .90, .95, .99)                # Specificity of the test

# Collect simulation parameters in list
(param_list <- list("rate" = rate_grid,
                   "pop" = pop_grid,
                   "sensitivity" = sens_grid,
                   "specificity" = spec_grid))
## $rate
## [1] 0.001 0.010 0.050 0.100 0.200
##
## $pop
## [1] 100000
##
## $sensitivity
## [1] 0.85 0.90 0.95 0.99
##
## $specificity
## [1] 0.85 0.90 0.95 0.99
In order to test how these parameters affect the false positive (and false negative) rate, we run 1,000 tests on each combination.
# Run simulation
result <- MonteCarlo(func = test_sim,            # pass test function
                     nrep = 1000,                # number of tests
                     param_list = param_list)    # provide parameters


# Create result data frame
df <- MakeFrame(result) %>% tbl_df %>%
  mutate(test_result = ifelse(infected == 0 & test == 0, "correct negative",
                              ifelse(infected == 1 & test == 1, "correct positive",
                                     ifelse(infected == 0 & test == 1, "false positive",
                                            ifelse(infected == 1 & test == 0, "false negative", NA)))))
head(df)
## # A tibble: 6 x 7
##    rate    pop sensitivity specificity infected  test test_result
##   <dbl>  <dbl>       <dbl>       <dbl>    <dbl> <dbl> <chr>
## 1 0.001 100000        0.85        0.85        0     0 correct negative
## 2 0.01  100000        0.85        0.85        0     0 correct negative
## 3 0.05  100000        0.85        0.85        0     0 correct negative
## 4 0.1   100000        0.85        0.85        0     0 correct negative
## 5 0.2   100000        0.85        0.85        0     1 false positive
## 6 0.001 100000        0.9         0.85        0     0 correct negative
The resulting data frame now includes 1,000 tests per combination and a column that indicates whether the test was a false positive, false negative, correct positive or correct negative. We can see that the fifth case is already a false positive.
The following figure visualizes the results (click on image to enlarge!). I deliberately excluded all “correct negative” results as they make up the majority of the test results.
# plot
df %>%
  filter(test_result != "correct negative") %>%
  group_by(rate, sensitivity, specificity) %>%
  summarise("correct positive" = length(which(test_result == "correct positive")),
            "false negative" = length(which(test_result == "false negative")),
            "false positive" = length(which(test_result == "false positive"))) %>%
  gather(key, value, -rate, -sensitivity, -specificity) %>%
  mutate(value = value/10000) %>%
  ggplot(aes(x = specificity, y = value, color = key)) +
  geom_point() +
  geom_line() +
  scale_color_brewer(palette = "Dark2") +
  facet_grid(rate ~ sensitivity) +
  theme_bw() +
  labs(y = "probability (% in all tests)", color = "test result")
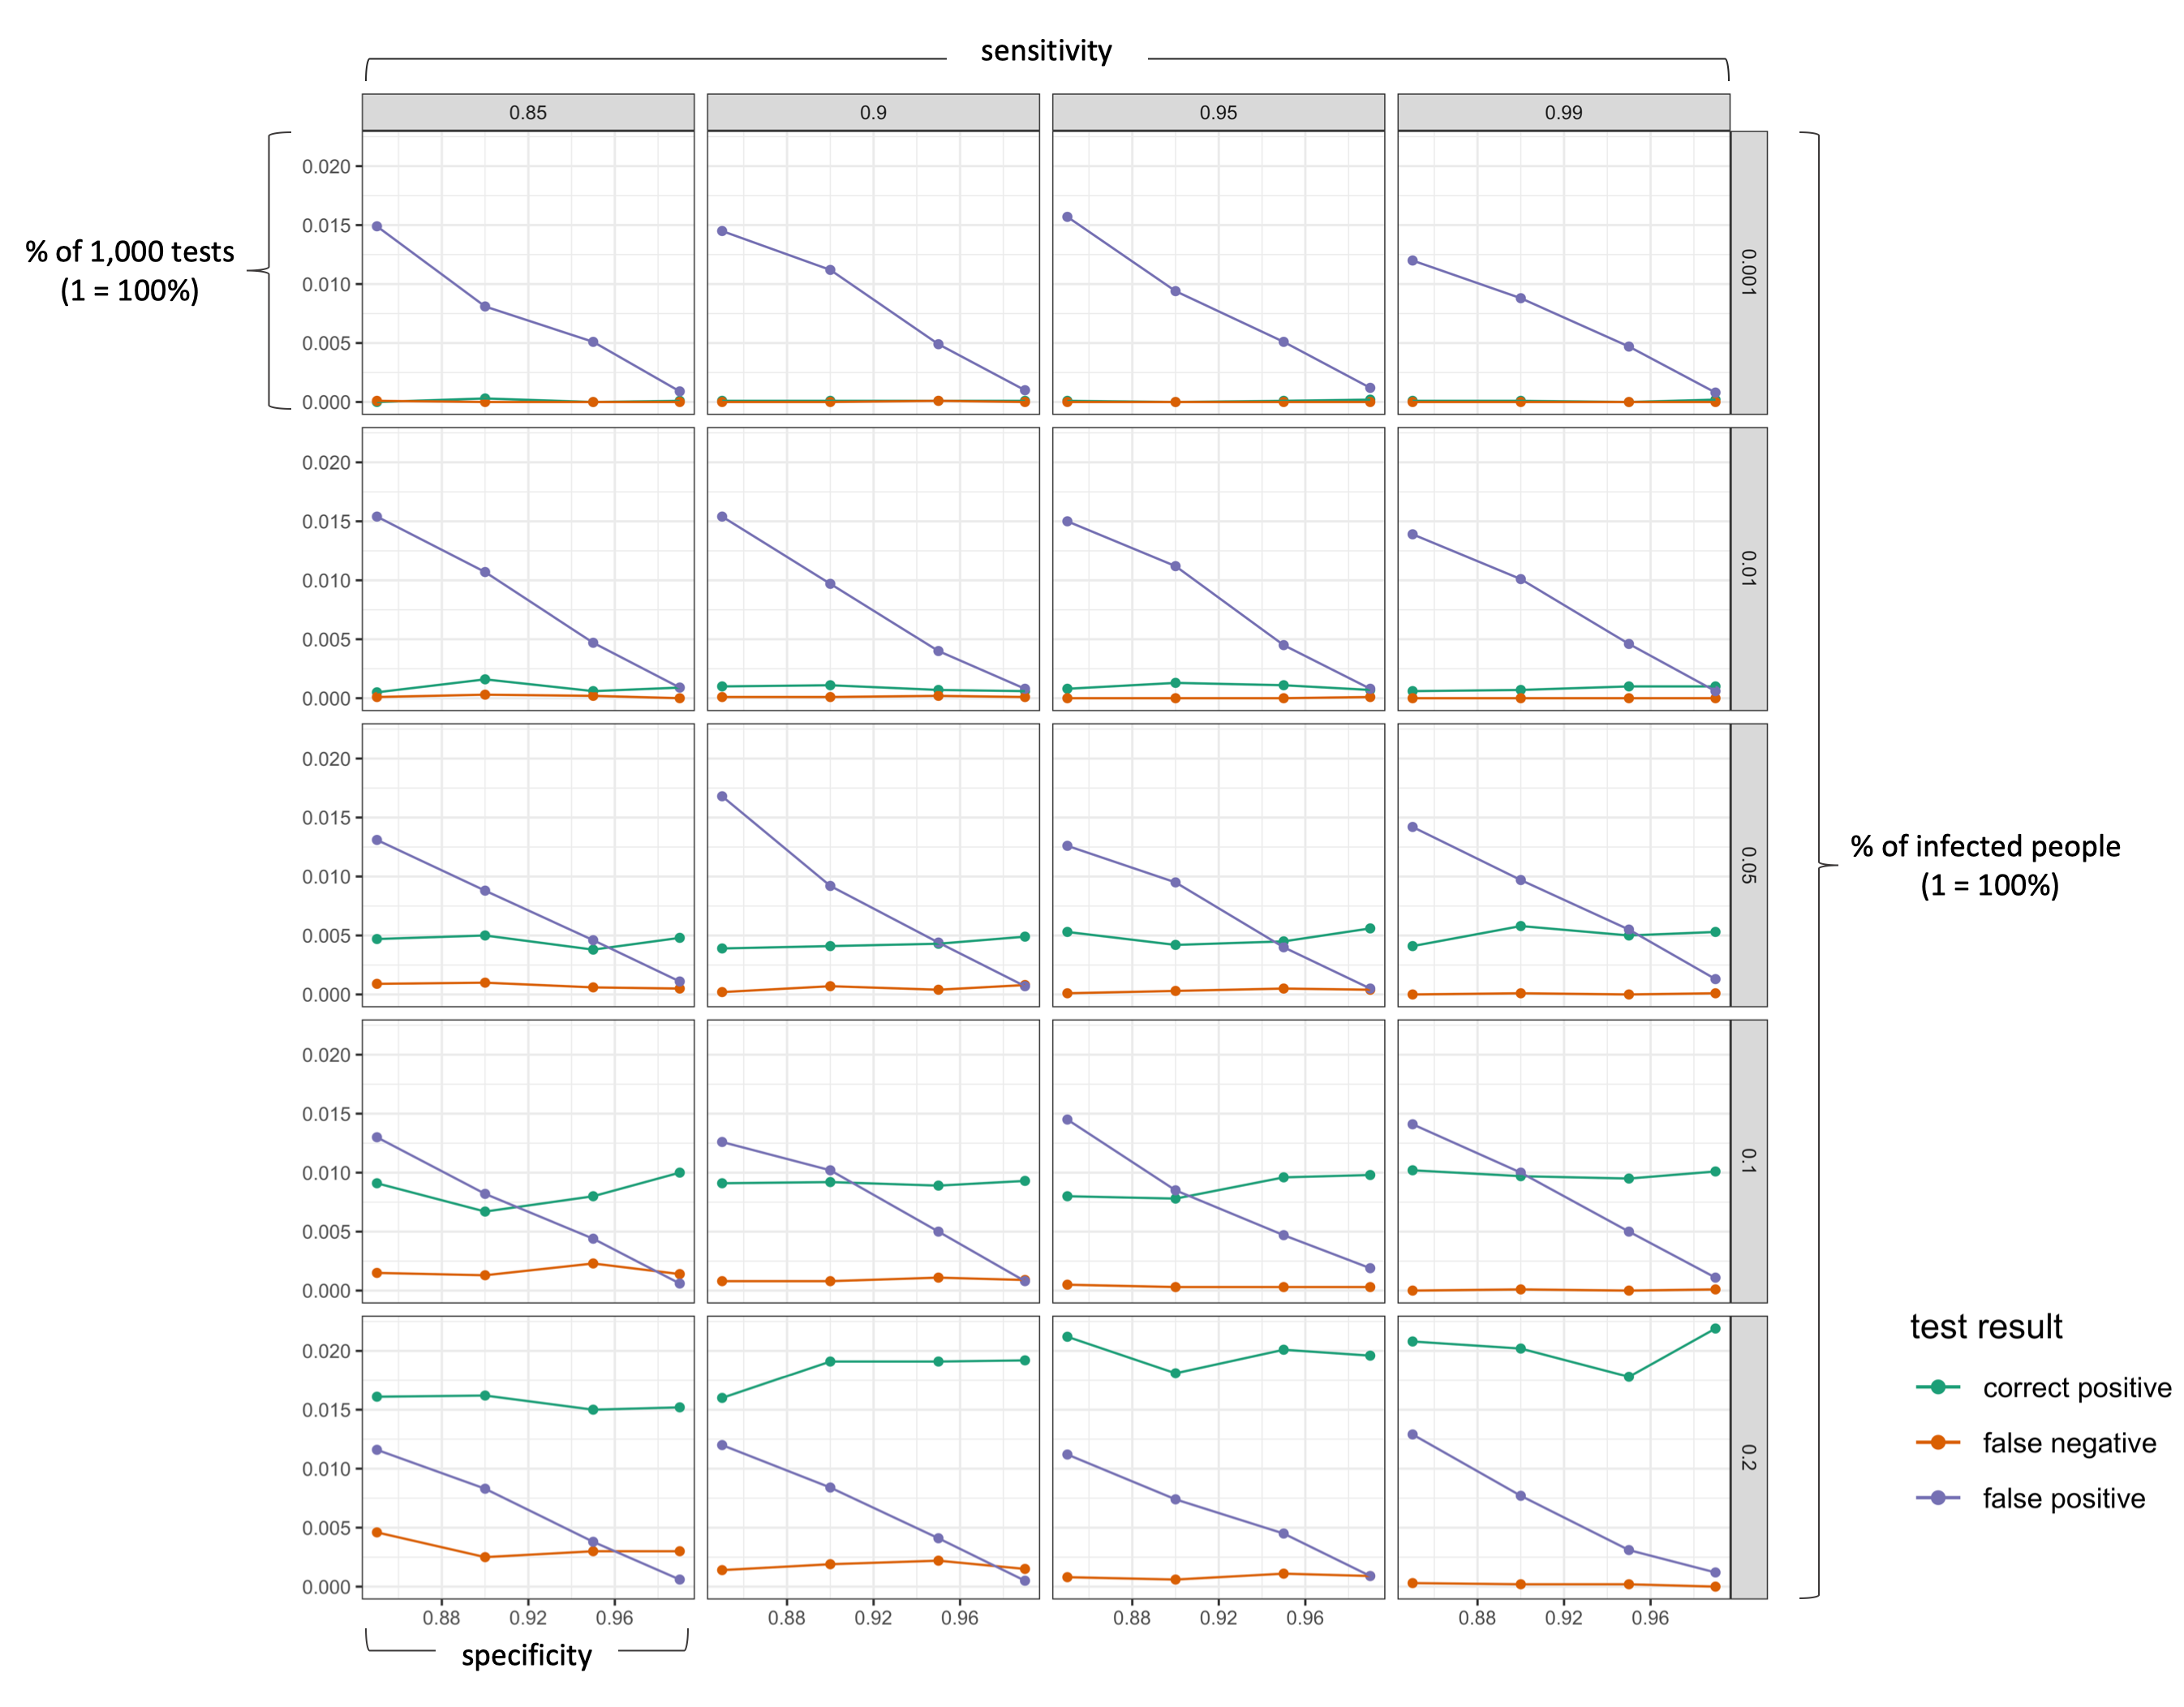
We can clearly see that the false positive rate increases strongly if a test has a lower specificity (as we would expect). More importantly, however, is the effect of the actual infection rate in the population. As long as the number of actually infected people in a population is very low (< 5%), a positive test results is more likely to be a “false positive” than a “correct positive”. Only with a very good specificity (>99%), the probability of being correctly identified as positive is as likely as being wrongly identified as positive (which is still pretty bad!). In the current situation, a single antibody test can thus hardly tell us whether we are actually immune. So what can we do? First, understand the problem. If you know that a positive result is likely to be a false positive, you will probably be more cautious in going back to normal life. Second, the probability of a “false positive” result decreases substantially if one takes more than one test. For example, obtaining a positive test result three times in a row should give you a greater confidence that you body actually has antibodies.
Take home message
A highly specific antibody test (e.g., Pr(tests+|is+) = 0.95) does not mean that the probability of being correctly identified as “positive” (i.e, Pr(is+|tests+)) is also high. In simple words, a large amount of people (the majority) who will get a positive test results are in fact not immune.
Footnotes
- Cellex test description: https://www.fda.gov/media/136625/download; Comment by the MIT Technology Review: https://www.technologyreview.com/2020/04/09/998974/immunity-passports-cornavirus-antibody-test-outside/.
- For a comprehensive discussion of this problem, see pp. 103-105 in the great book “Doing Bayesian Data Analysis” by Kruschke (2015).
I refer to your conclusion “A highly sensitive antibody test (e.g., Pr(tests+|is+) = 0.95) does not mean that the probability of being correctly identified as “positive” (i.e, Pr(is+|tests+)) is also high”.
The correct statement should be “A highly specific antibody test…”.
Thanks, Keng! Absolutely right.
Great insights, but now apply it to actual testing for COVID. You will see with a CDC postd value of 70% sensitivity and an infection rate of 7.5%, the testing has been a complete sham, and has been the major driver in all poor decision-making.