statistics

What is ‘item sampling’ and why is it useful? Or how can we can measure person characteristics with large item pools?
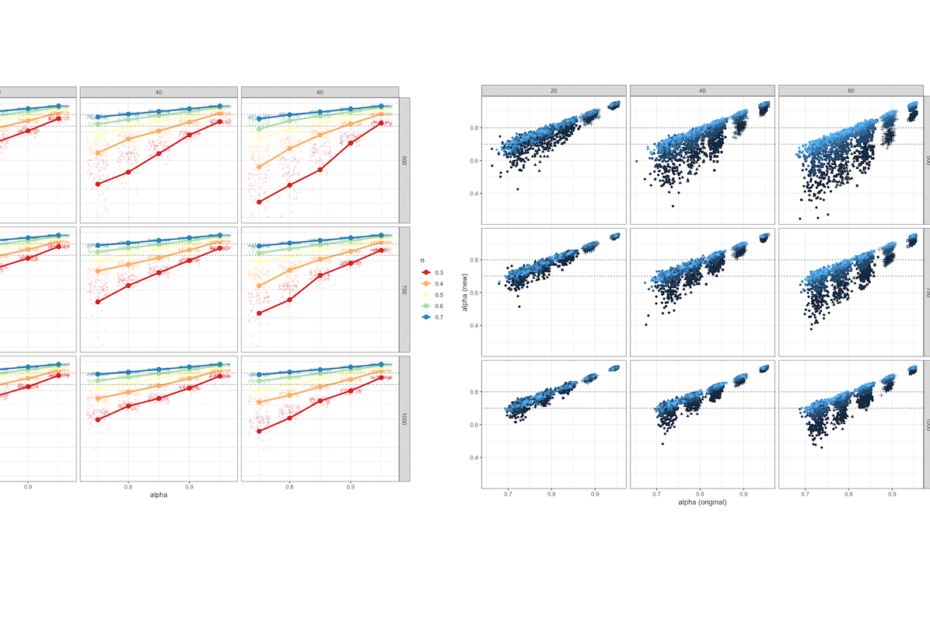
I guess every social scientist at one point has been confronted with a quite common dilemma: We know that we would need a quite large number of items to assess a certain latent concept comprehensively and validly, but we do not have enough space in our questionnaire to use the entire long scale or even inventory. More often than not, we then choose the “best” items (e.g., with the highest factor loadings). However, by reducing… Read More »What is ‘item sampling’ and why is it useful? Or how can we can measure person characteristics with large item pools?
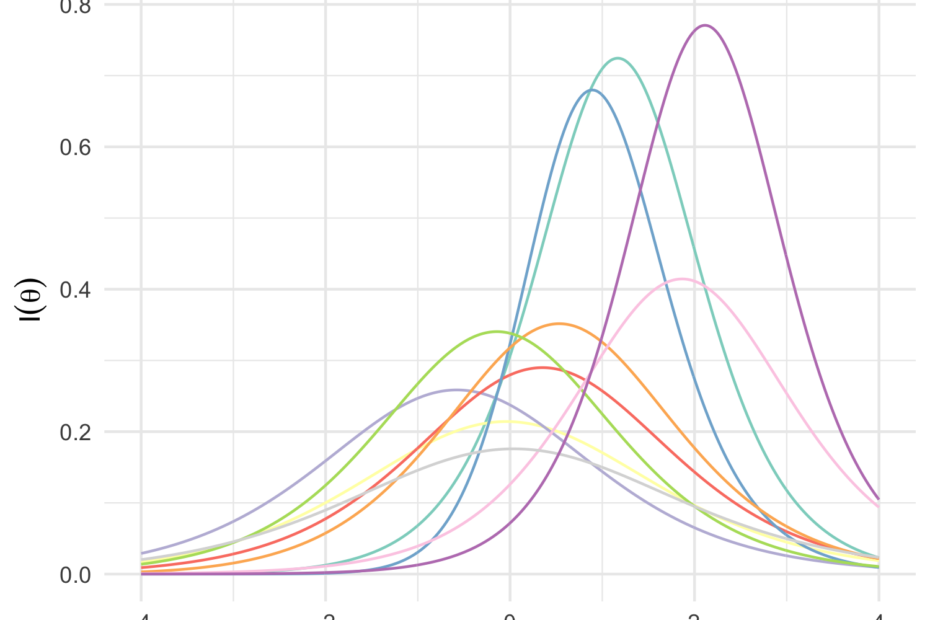
What is statistical power? And how to conduct power analysis in R?

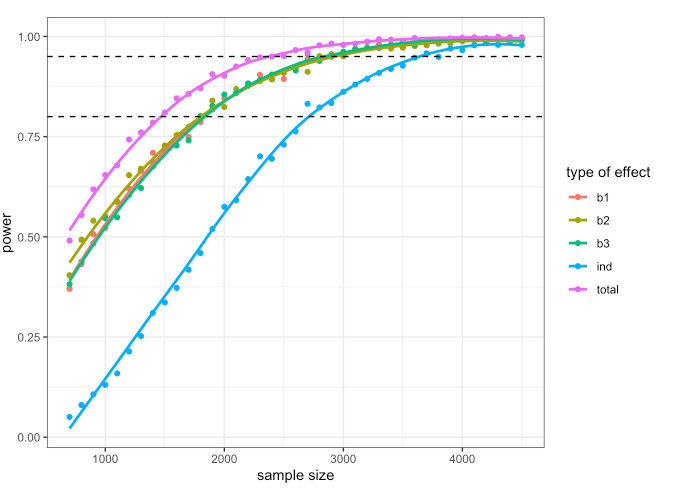
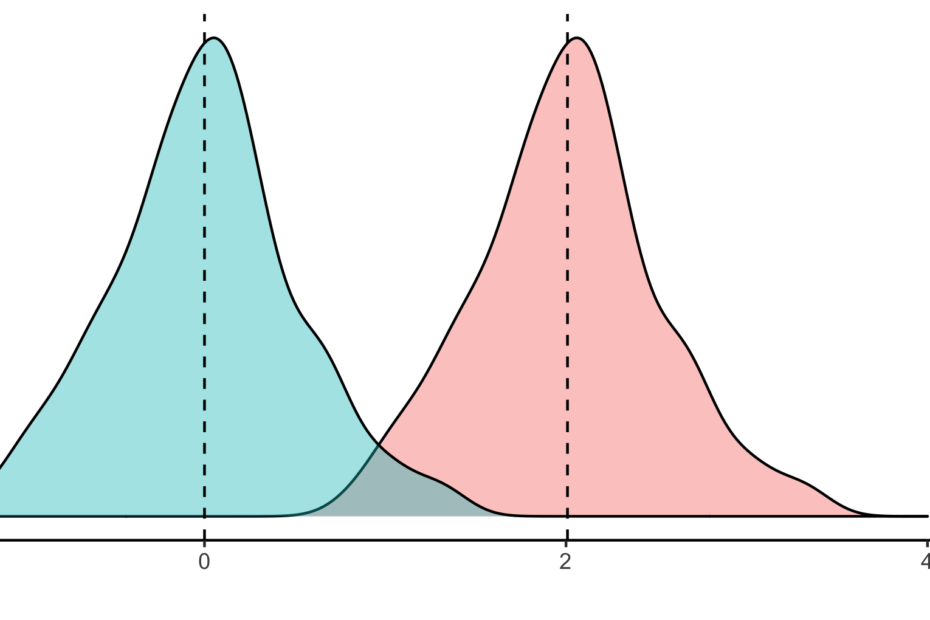
“The power of a statistical test is the probability that it will yield statistically significant results. Since statistical significance is so earnestly sought and devoutly wished for by behavioral scientists, one would think that the a priori probability of its accomplishment would be routinely determined and well understood. Quite surprisingly, this is not the case. Instead, if we take as evidence the research literature, we find evidence that statistical power is frequently not understood and,… Read More »What is statistical power? And how to conduct power analysis in R?

How to run IRT analyses in R

This post provides an introduction to fitting item response theory (IRT) models in R. From my experience, most scholars in the social sciences have heard about IRT as an alternative to classical test theory (and its methods such as EFA or CFA), but have never really worked with it. I believe that this is unfortunate as it offers a lot of advantages and insights into the validity and reliability of tests and items. In this… Read More »How to run IRT analyses in R

The problem of false positives: Antibody tests in times of Corona

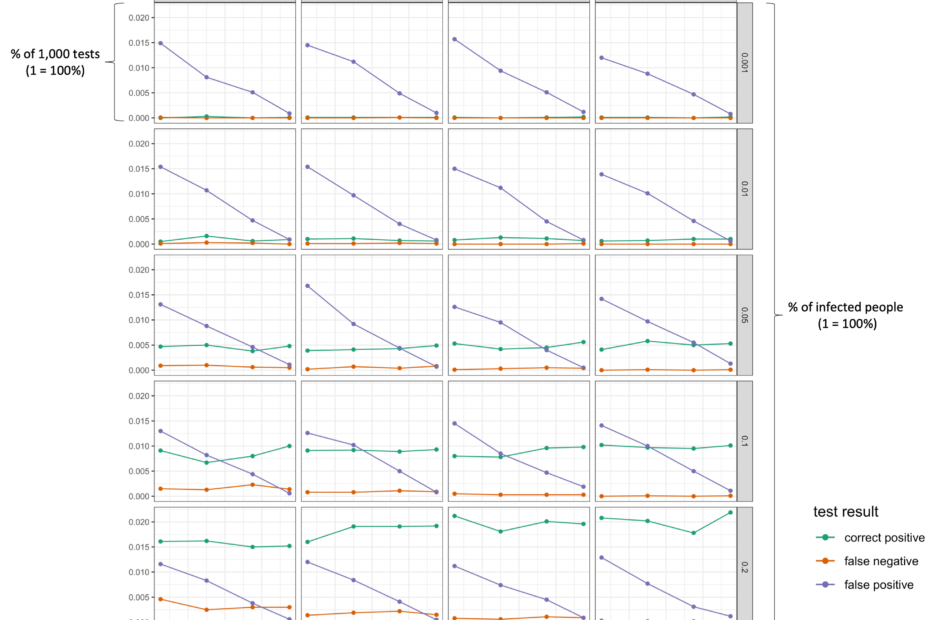
A few weeks or months from now, we could have a Covid-19 test kit sent to our home. Similar to a blood sugar test for diabetics, we would prick our finger, wait for a couple of minutes, and we will know whether we are immune or not. The general idea is that this would help in lessen the social distancing restrictions because those who are immune could in principle go back to a normal life.… Read More »The problem of false positives: Antibody tests in times of Corona

How to do power simulations for structural equation models in R

Computing a priori power analyses for simple statistical models can be done analytically (e.g., with G*Power or the pwr package in R). However, estimating the power for more complex models and in particular structural equation models (SEM) is not as straightforward and requires simulations. I recently came across the package paramtest (Hughes, 2017) which provides a great framework for conducting more complex power simulations. In what follows, I provide some examples of how to simulate… Read More »How to do power simulations for structural equation models in R

How to do specification curve analyses in R: Introducing ‘specr’

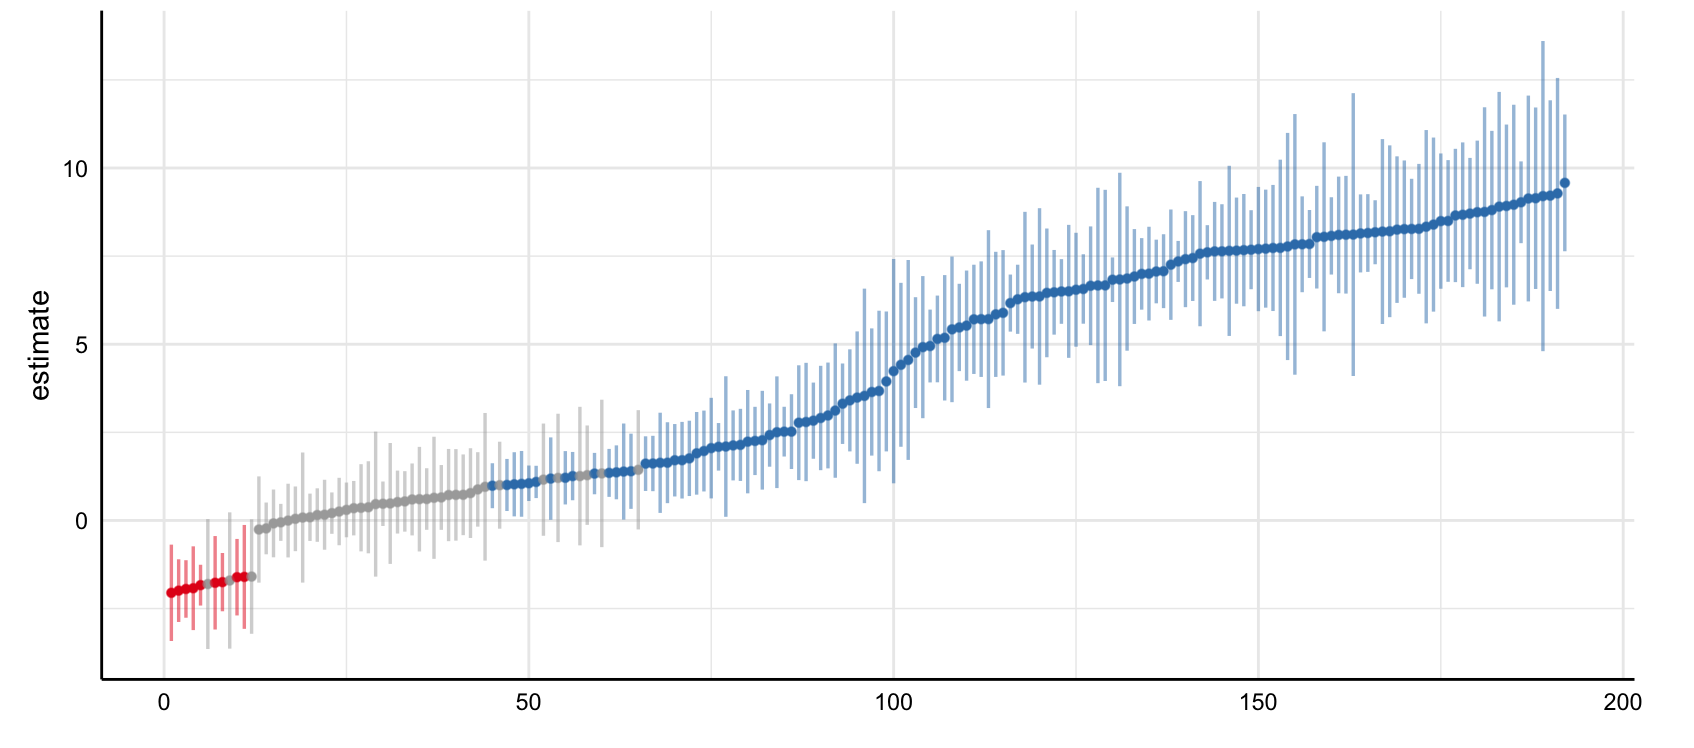
In the last month, Michael Scharkow and I have worked on a new R-package called specr. The goal was to facilitate specification curve analyses (also called multiverse analyses). The idea behind a specification curve analysis stems from the observation that a researcher has many degrees of freedom when conducting a quantitative analysis of a data set and sometimes, we do not really know how different decisions may impact the results. It starts with the question… Read More »How to do specification curve analyses in R: Introducing ‘specr’

How to visualize interaction effects

I recently gave a workshop on data visualization. One of the topics was visualizing interaction effects (or “moderation” analyses). I think it is a great topic because it exemplifies quite well that there is not one solution to all problems. In general, I would argue that trying to visualize interaction effects is great idea. Due to the conditional nature of the effects obtained from standard regression analyses that include an interaction term, it is often… Read More »How to visualize interaction effects

How to center in multilevel models

Have you ever thought about centering your variables before running an regression based analysis? From my personal experiences, chances are high are that you haven’t: Although a useful data transformation procedure for many statistical analyses, centering is seldom taught in fundamental statistic courses. Although the mathematical principles behind it may seem arbitrary, its implications are oftentimes quite strong. Although centering is already useful in standard statistical modeling (e.g., OLS regression), its usefulness is particularly evident… Read More »How to center in multilevel models